 "Tristan" (casselts)
01/19/2019 at 14:08 • Filed to: None
 0
0
 30
30|
"Tristan" (casselts)
01/19/2019 at 14:08 • Filed to: None | 0
| 30 |
You’re the smartest bunch of people on the internet, so if you can’t help me I’m doomed.
What we have here is data from 40,000 Oregon residents . Column 1 is category of military service. 1 is current active duty, 2 is prior active duty, 3 is Guard/Reserve and 4 is never served. Column 3 is public assistance received in dollars in the last 12 months . What I’m trying to do is make a formula that determines what percentage of people from each of the categories (1-4) has received public assistance >0. I think I need some sort of double-if function, but nothing I’m trying seems to work. Something along the lines of IF(A:A,1)COUNTIF(C:C= ”>0")... ( I know the formatting’s off, but you get the gist) . But I just keep getting zeros. I’m trying to make a chart that compares the percentages of prior service and guard/reserve who have had to tap public assistance to the percentage of those who have never served as a way of examining whether career training provided by the military has helped veterans remain more or less self-sufficient .
Thank you... You’re all smrt and I’m dum.
 DC3 LS, Fuck Hyundai, now and forever
> Tristan
DC3 LS, Fuck Hyundai, now and forever
> Tristan
01/19/2019 at 14:31 |
|
When do you need this done? I can’t do it in excel, but I could probably do it in Java. It’s take me a day or two and you’d have to run the program outside of excel, but it’d be able read the excel file.
 vondon302
> Tristan
vondon302
> Tristan
01/19/2019 at 14:32 |
|
I can’t brain today I got the dumb.
|
Tristan
> DC3 LS, Fuck Hyundai, now and forever
01/19/2019 at 14:36 |
|
Yikes... um... oh boy. Now you’re going way over my head. Unfortunately I wasted a bunch of time struggling with this on my own and now it’s due at midnight tonight. If it’s not as easy as a an Excel formula, I may scrap this and do something simpler. :/
|
Tristan
> vondon302
01/19/2019 at 14:37 |
|
Sleep deprivation is giving me the brain rot.
 Discerning
> Tristan
Discerning
> Tristan
01/19/2019 at 14:41 |
|
Edit. Didn't read your request closely. See other post with countifs formula
 someassemblyrequired
> Tristan
someassemblyrequired
> Tristan
01/19/2019 at 14:41 |
|
SUMIF might be what you need... https://support.office.com/en-us/article/sumif-function-169b8c99-c05c-4483-a712-1697a653039b
ETA: Oh wait, yeah you want COUNTIF. Check your syntax and work with a small data set. Here’s an example: https://support.office.com/en-us/article/countif-function-e0de10c6-f885-4e71-abb4-1f464816df34
There's also COUNTIFS if you have multiple criteria...
 Akio Ohtori - RIP Oppo
> Tristan
Akio Ohtori - RIP Oppo
> Tristan
01/19/2019 at 14:45 |
|
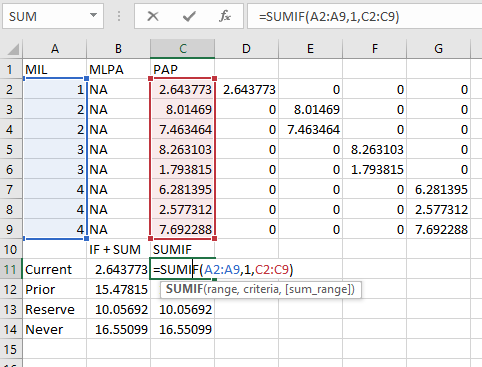
Ok.... I did it the hard way and then found an easy way. What you’re looking for, apparently, is SUMIF
example:
=SUMIF(A2:A10,1,C2:C10)
Where A2:A10 is the MIL column, 1 is the parameter your looking for, and C2:C10 is the PAP column. I tried it two different ways and this seems to work.
 Cash Rewards
> Tristan
Cash Rewards
> Tristan
01/19/2019 at 14:47 |
|
This is a lot easier to so with a file in front of me. The dumb way to explain easy is make 4 extra columns. One column have fornula if ( a1=1 and b1>0), 1. Second column is if ( A1=2 and b1>0) , 1. So you have four columns, where each row has a 1 in a column and blanks in the other three. Then sum bottom of each column.
There are more elegant ways to do it, but that will brute f orce your way through. Might need dollar signs in front of the letters, but not numbers, as you fill down for the formulas.
Make sense?
 Skyman
> Tristan
Skyman
> Tristan
01/19/2019 at 14:49 |
|
What you need is a pivot table..
|
Discerning
> Tristan
01/19/2019 at 14:51 |
|
If you have to do it in a formula, you can use countifs
|
Discerning
> Akio Ohtori - RIP Oppo
01/19/2019 at 14:53 |
|
I think countifs is the way to go

|
Discerning
> someassemblyrequired
01/19/2019 at 14:56 |
|
He wants countifs. Criteria 1 is the type of military person. Criteria 2 is if the other field is greater than zero.
|
Tristan
> Skyman
01/19/2019 at 14:58 |
|
I agree, but the assignment specifies not using a pivot table. LAME!
|
Tristan
> Discerning
01/19/2019 at 14:59 |
|
That’s the one! You rock!
 WilliamsSW
> Tristan
WilliamsSW
> Tristan
01/19/2019 at 15:00 |
|
At least use the pivot table to check your work then! :)
 f86sabre
> Tristan
f86sabre
> Tristan
01/19/2019 at 15:01 |
|
(Count total then subtract countif of those who are not on PAP) x 100
I think. I don’t think countif supports two arguments in a single action. That’s why the subtraction.
 TheRealBicycleBuck
> Tristan
TheRealBicycleBuck
> Tristan
01/19/2019 at 15:01 |
|
You’ve received several answers that will work. I offer another: pivot tables. Start by clicking on a cell in the table (MIL would be best). Hit CTRL -t to turn it into a real table. Then click on the insert tab and select pivot table. Have it create the table in a new sheet. From there you can slice and dice the data as you please, including automatically calculating percentages.
|
Tristan
> TheRealBicycleBuck
01/19/2019 at 15:02 |
|
Prof wants it done the hard way. No pivot tables allowed. :(
|
Discerning
> Tristan
01/19/2019 at 15:02 |
|
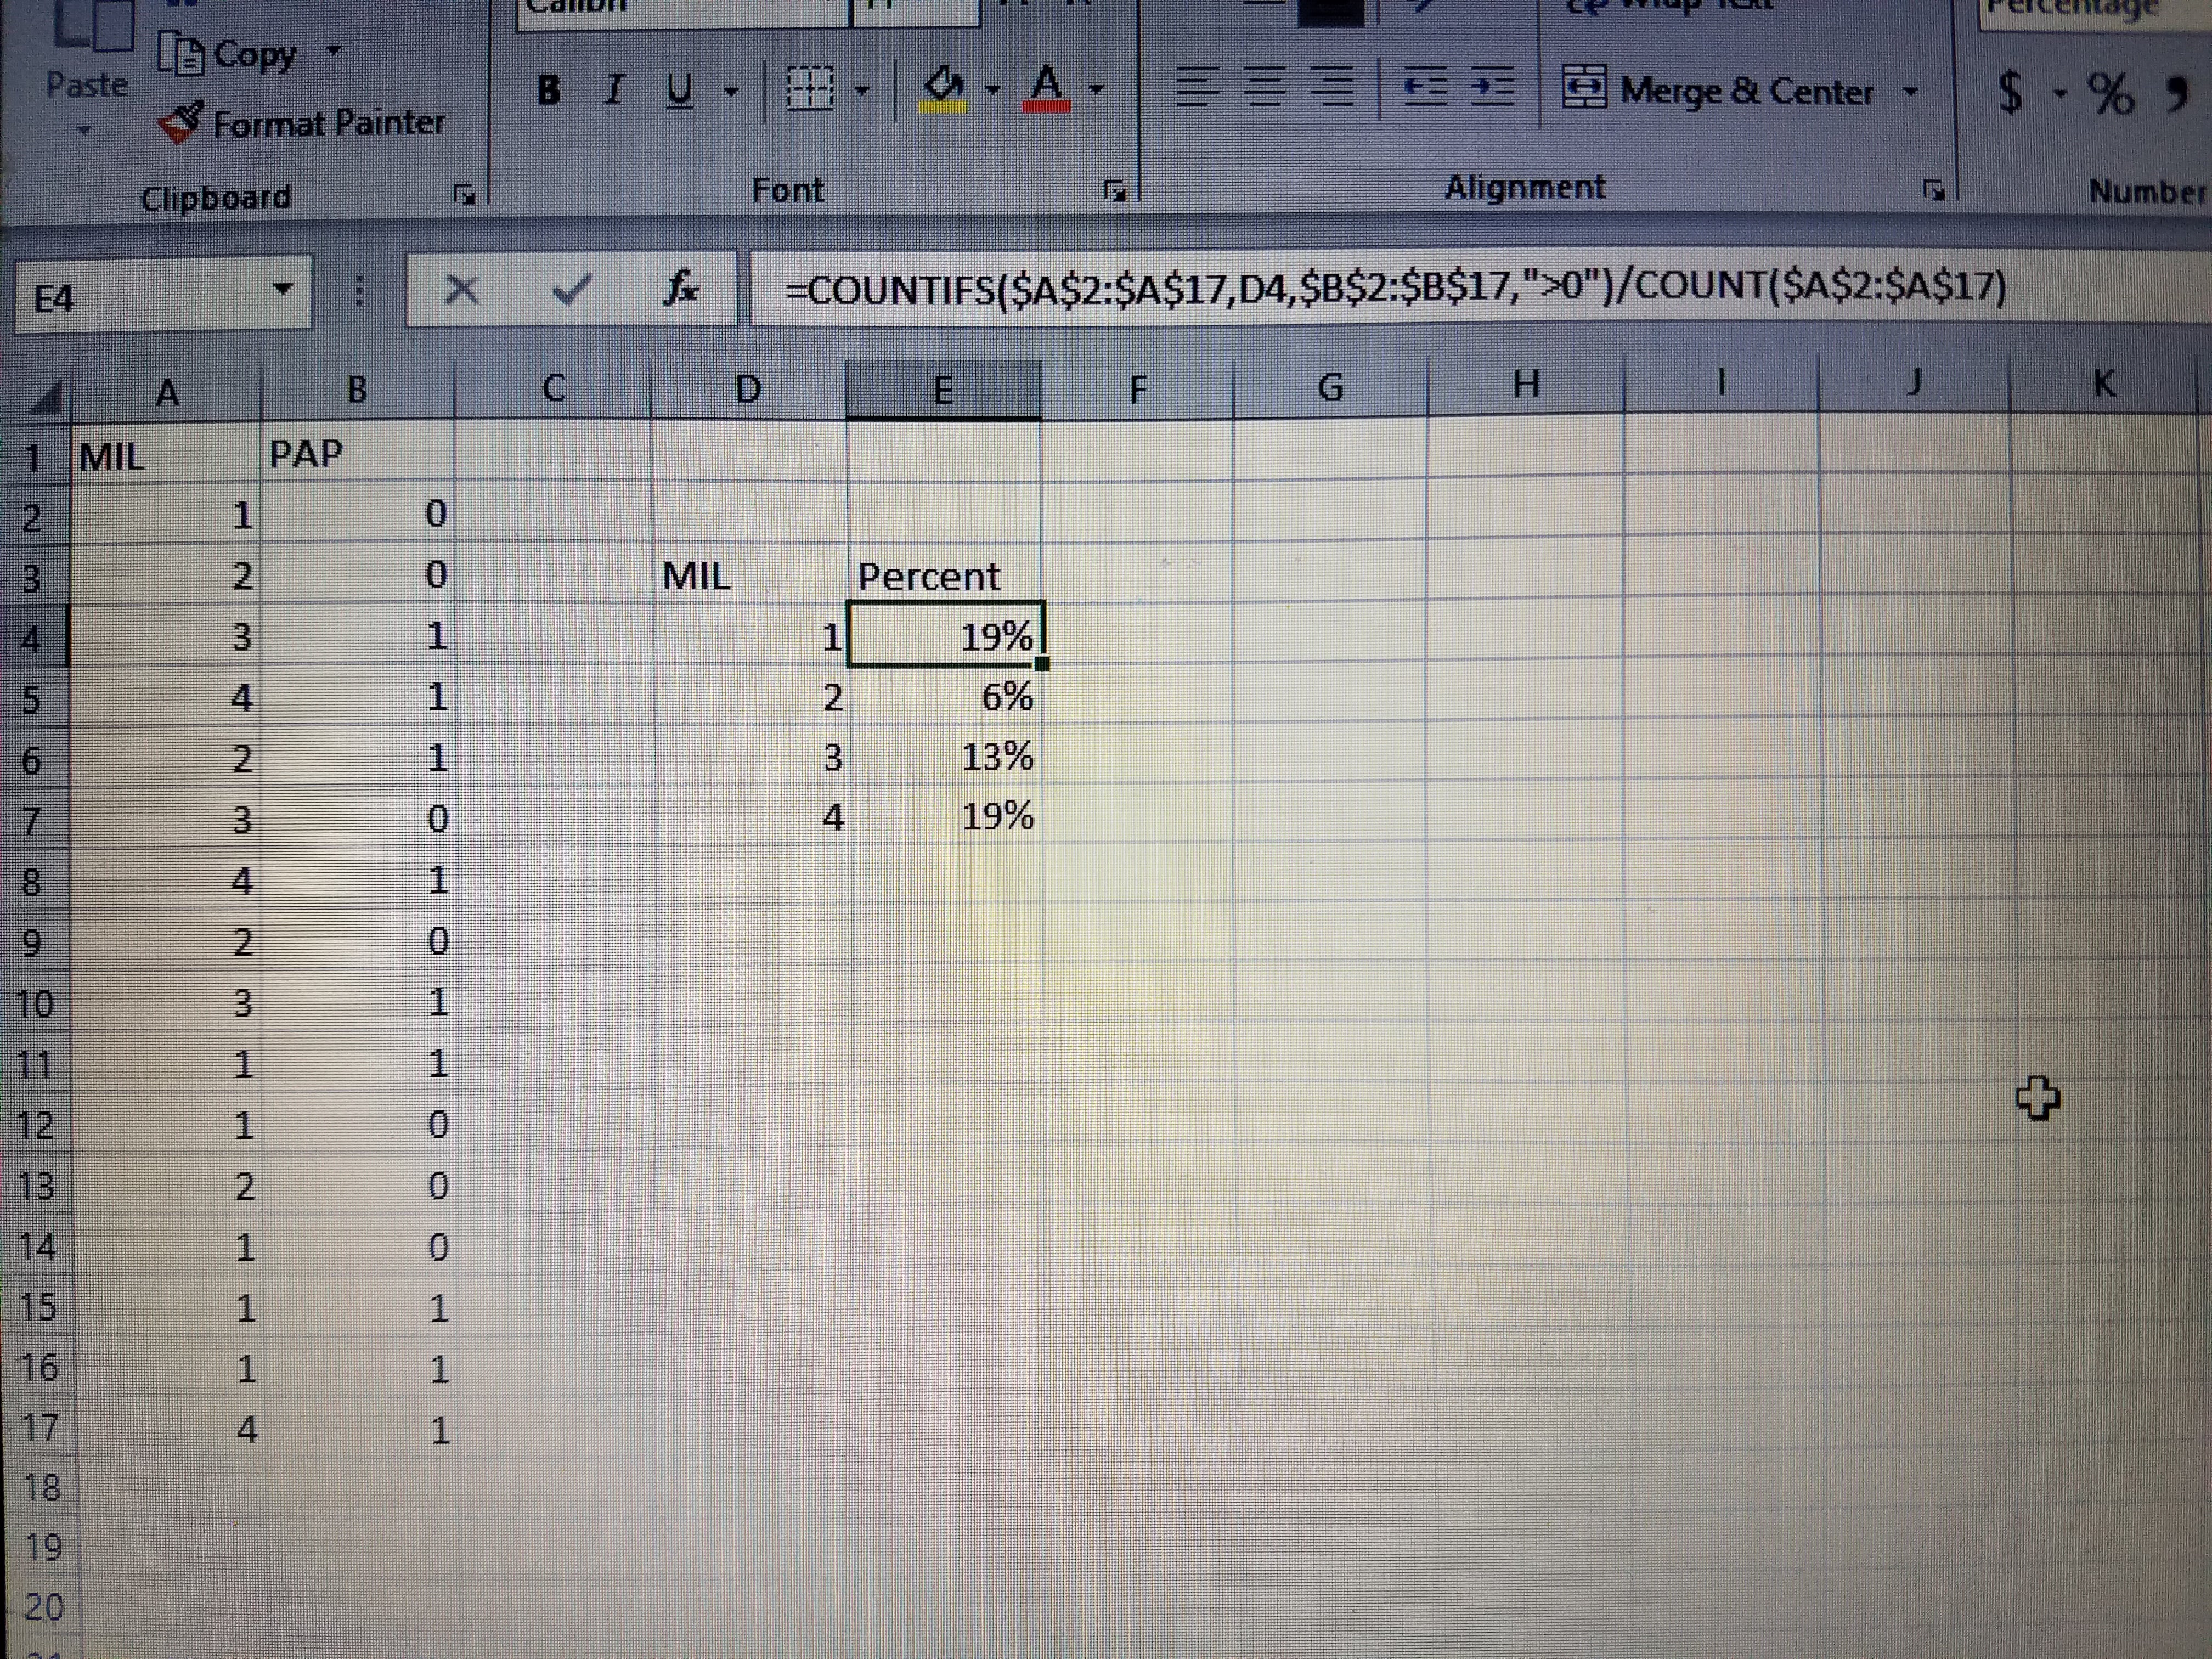
I hope you used formula I posted in the other post. See image.

Do you need a percent of total for either column b or column c greater than zero?
If so, you can add two countifs together and divide by a count
|
Tristan
> Discerning
01/19/2019 at 15:05 |
|
Yessir. I copied your homework. Plz no tattle. Here’s what I used specifically as there’s 40,000 rows of data.
=COUNTIFS(A:A,E2,C:C,”>0")/COUNTIF(A:A,E2)
|
f86sabre
> f86sabre
01/19/2019 at 15:07 |
|
=(count(a2:ax)-countif(c2:cx “>0”))
Or something close. Logic boils down to determine total, determine number in each duty category and then determine number that got aid. Find percent.
|
Discerning
> Tristan
01/19/2019 at 15:10 |
|
Hmmmmmm. That will give you the percent of a particular set “e2 .”
So if there are 100 types of whatever is in e2 and 23 of them are greater than 0 for column c, it will return 23%
If you need a percent of everyone and not just e2 field, divide by a simple count of column a.
Otherwise you should be good.
I recommend sanity testing anything you go for with a smaller set too, as others suggested.
|
Tristan
> Discerning
01/19/2019 at 15:17 |
|
E2 just references the meanings of the numbers 1-4 in column A. E2 is 1, E3 is 2, and so on. Makes it easier to autofill the formula for all 4 criteria.
|
Discerning
> Tristan
01/19/2019 at 15:27 |
|
But are you trying to get a percent of each 4 types, or a percent of the total population? Your current formula doesn't give you percent of total population.
|
DC3 LS, Fuck Hyundai, now and forever
> Tristan
01/19/2019 at 15:41 |
|
I’m not saying it can’t be done in excel, just that I don’t know how :)
The time thing was more just with me being busy, not it’d be that hard.
|
TheRealBicycleBuck
> Tristan
01/19/2019 at 15:51 |
|
Bummer.
|
Tristan
> Discerning
01/19/2019 at 16:41 |
|
Percent of each type, so as to speculate on military training giving people an advantage in finding employment and not needing public assistance.
|
Discerning
> Tristan
01/19/2019 at 17:07 |
|
Go tcha. You should be good
|
someassemblyrequired
> Discerning
01/19/2019 at 18:05 |
|
Yep you're right, I added it in the edit but he definitely wants COUNTIFS
 HootingHermit
> Tristan
HootingHermit
> Tristan
01/19/2019 at 19:31 |
|
To calculate the percentage of each category that has received public assistance, use a combination of COUNTIF and COUNTIFS functions.
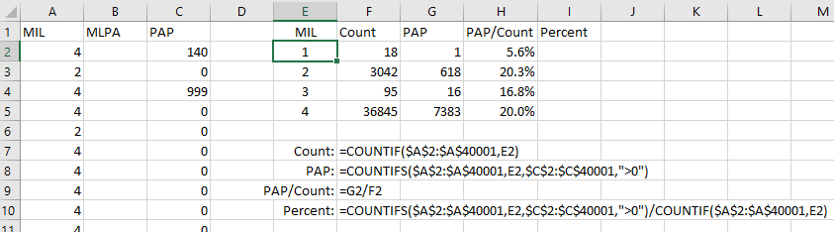
You can also format the data as a named table so that you don’t need to use anchored references.
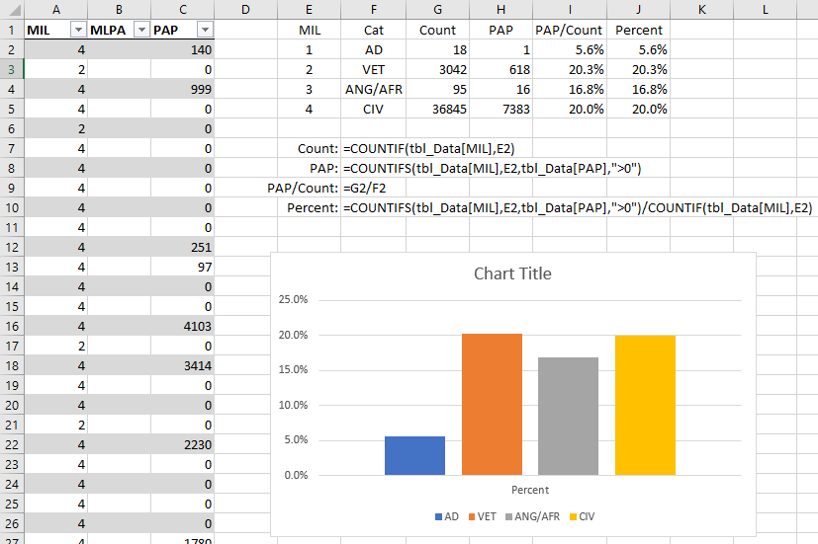
By combining the function used to count the number of individual in each category (Count)
with the function to count the number of individuals who received public assistance (PAP)
, you can calculate the percentage of each category who received public assistance.
Data is all notional.